Insurance is a complex business for the simple reason that we do not know what the future holds. Actuaries do their best to predict future claims, economic outcomes, and customer behaviours but there will always be uncertainty.
Stochastic models are fundamental for understanding the likelihood of adverse outcomes amidst this uncertainty. By modelling thousands of scenarios, we quantify the likelihood of tail risk events.
Use cases for stochastic models by actuaries include:
- Pricing and Risk Management – model exposure to rare, but severe, risks such as natural catastrophes or investment market meltdowns
- Capital Management – model insurance solvency under unlikely, but possible, scenarios to inform decisions on the capital that insurers should hold over and above regulatory requirements
- Value of Options and Guarantees – conduct pricing and valuation of life insurance products offering investment options and guarantees; regulatory solvency and accounting calculations, including IFRS 17, require stochastic modelling for such products
- Reinsurance Strategy – review the potential impact of alternative levels of reinsurance cover
The well-known actuarial systems all have stochastic modelling functionality. Where heavy-duty stochastic models are set up within such systems, then all is good. But often actuaries build stochastic models in spreadsheets. The intention is usually for a “proper actuarial system” to replace the Excel model – sometimes this indeed happens; often it does not.
There are pros and cons to using Excel for stochastic modelling:
| Pros | Cons |
|---|---|
| Quick and easy for actuaries to build E.g., for modelling new products or emerging risks and for ‘challenger models’ that sense-check existing models | Slow run times Often too slow to be of use without severely limiting the number of simulations |
| Not a black box – you built it, so you understand it Contrast with “proper actuarial systems,” which can be very opaque | Hard to test, version and control. Model governance inferior to that of a “proper actuarial system” |
| No need for specialist programming skills | No connectivity to other software applications |

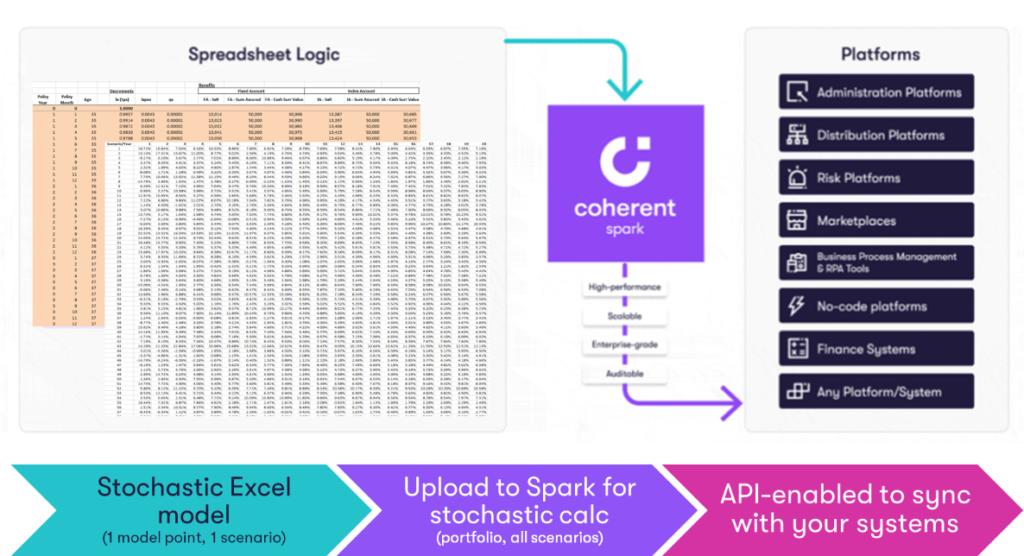
It can take minutes to run a single scenario in a complex model in Excel. Yet most stochastic processes require thousands of simulations – and then repeat this for every policy in the portfolio. Excel is simply too slow. By deploying the Excel model in Spark, stochastic modelling becomes feasible:
- Spark’s code runs many times (10x – 100x) faster than Excel.
- Coherent’s cloud computing power automatically scales according to the required processing workload.

Building actuarial models is an iterative process. The need for testing and version control becomes paramount as model complexity expands. Spark compares the latest version with its predecessors and retains all prior versions for reference and auditability.
Loading a model into Spark automatically creates an API for access to the model’s inputs and outputs. For example, input investment market data to power stochastic scenarios and output to a management information dashboard.
In short, Spark turns your Excel-based stochastic models into a “proper actuarial system”!
Case Study 1: Optimizing reinsurance strategy
A US insurer provides multi-perils cover for flood, fire, and storm damage. The insurer annually reviews its reinsurance cover for tail risks as part of its risk management process.
Reinsurance structures can be complex; variables include the level of deductible and the proportionate share of losses taken by the reinsurer. Stochastic modelling of extreme events quantifies net (after reinsurance) losses under alternative reinsurance structures.
The insurer’s existing claims models simulated the frequency and severity of losses separately for each of flood, fire, and storm. The run times of these Excel models were too slow to allow the actuaries to experiment freely with alternative claims distributions and reinsurance structures. Hence an opportunity for Coherent Spark…
We calibrated various statistical distributions assumptions for each of the three perils. For example, out of 50,000 scenarios, the existing distribution predicted 250 scenarios with one hurricane and only a single scenario with two hurricanes. We considered this an overly optimistic view of tail risk based on the actual claims experience.
Having selected the distributions, we then looked at the relationship between these three perils. For example, a year with extreme storms is likely to also experience high flood claims. But wildfire claims have a lower correlation with the other two perils. There are well-established actuarial techniques for modelling such correlations and Spark enabled us to readily compare alternative approaches.
The insurer then needed to model the impact of multiple reinsurance contracts on its portfolio. Once again, the advantages of Excel’s flexibility for defining the parameters and Spark’s powerful run times were apparent.
We uploaded the outputs from Spark back to Excel to automatically produce the required reports and visuals for presentation to senior management. We could change the distributions or reinsurance structures, and produce an updated report, at the touch of a button.

Case Study 2: A new Indexed Universal Life Product
A life insurer’s product team was investigating the feasibility of introducing a Universal Life policy for the HNW segment with policy returns linked to the S&P 500 index.
The pricing spreadsheet projected account balances in future years. Variables included:
- Policyholder details
- Sales costs and other policy charges
- Cost of insurance charges
- Persistency
- Loyalty bonuses and other product features
The profitability of the product partly depends on index returns. The product team required a stochastic approach to quantify the likelihood of the profit margin meeting the insurer’s required product KPIs. Running the model on Coherent Spark made this feasible. We compared different distributions for S&P performance across a portfolio of sample customers.
Spark also powered a prototype sales illustration tool – providing customers with policy projections and various “what-if” scenarios to illustrate the range of policy options.

The product team debated whether providing customers with information on the probability of achieving target returns, based on the stochastic modelling, would be helpful. They decided that this would be confusing to customers. Even with Spark’s ability to handle complexity, modelling should focus on communicating the right insights, rather than technical complexity.
In summary, as our experience and several case studies have shown, Excel is a wonderfully flexible tool for determinist modelling, but is too slow for stochastic simulations. Coherent Spark changes that. Now you can readily quantify risk and so add a whole new dimension to making key business decisions.
To learn more about how Coherent Spark can benefit your company, contact us to schedule a demo and a discussion with our actuarial and technology teams.
Want to read it later? Download the eBook below so you can read whenever you want, wherever you want, even without an internet connection.
Bob Charles
Head of Actuarial, Coherent
Bob Charles is an actuary who enjoyed a 30-year career with Willis Towers Watson, culminating in leading the Asia Pacific business. He subsequently worked with insurance technology start-ups. Bob is currently the Head of Actuarial at Coherent, working with clients on finding great uses-cases and applications for our unique Spark technology.
-
This author does not have any more posts.
Henry Chan
Senior Actuarial Manager
Henry has over 10 years actuarial experience in General Insurance. He enjoys solving insurance business problems with technologies. Prior to joining Coherent, he worked as Director at Travelers UK to deliver actuarial process transformation and Head of Reserving at Markerstudy Insurance UK. Henry holds a Masters in Risk and Stochastics at London School of Economics and is a Fellow of the Institute of Actuaries (FIA).
-
This author does not have any more posts.


